Fueling
How many calories you burn cycling, running and swimming
Calories burned cycling, running and swimming, with worked estimates from power meters, pace and METs, plus the assumptions behind every number.

Riding at a steady 200 W burns an estimated 720 to 860 kcal per hour, assuming a gross efficiency of 20 to 24%, roughly the range reported from lab studies of trained men to world-class professional cyclists. Running costs roughly 1 kcal per kg of body mass per km at steady paces on flat ground, and an hour of freestyle laps costs roughly 5.8 to 10.5 kcal per kg depending on speed [4, 5, 8, 9, 10, 11]. Every one of these figures is an estimate. Your own number depends on your efficiency, technique, body mass and how the estimate was made.
Three ways to estimate calories burned
Mechanical work from a power meter (cycling only). The power meter measures your mechanical work output. Converting that to calories requires an assumed efficiency.
METs from the Compendium of Physical Activities. The 2024 Adult Compendium lists energy costs for 1,114 activities, 912 of them based on measured values [1]. One MET is defined as 1 kcal per kg of body mass per hour [5], so kcal = MET x body mass (kg) x hours.
Wearable algorithms. Watches and straps estimate energy expenditure from heart rate, movement and personal data. Accuracy varies widely (see below).
How many calories does cycling burn?
Converting kJ to kcal
A power meter reports work in kilojoules (kJ). Average power in watts multiplied by seconds gives joules. To get the energy your body used, divide by gross efficiency, the ratio of work done to total energy expended [16], then convert units (1 kcal = 4.184 kJ [10]):
kcal burned = kJ of work / gross efficiency / 4.184
Gross efficiency is not a fixed number. In one study of 17 trained men on a cycle ergometer it averaged 19.8% [8], and in world-class professionals riding at about 385 W it averaged 24.5% [9]. It also rises with work rate, mainly because the baseline energy cost that exists even at zero load becomes a smaller share of the total at higher power [7, 8]. That means each kJ costs more kcal on an easy ride than on a hard one.
Estimates calculated from the formula above. The popular “1 kJ equals 1 kcal” shortcut holds only if your efficiency is close to 24%.
Worked example: 2-hour ride at 200 W
Assumptions (estimate): 75 kg rider, 2 hours at 200 W average power, gross efficiency 20 to 24%.
Work: 200 W x 7,200 s = 1,440 kJ
Energy burned: 1,440 / 0.24 / 4.184 = about 1,430 kcal, up to 1,440 / 0.20 / 4.184 = about 1,720 kcal
Cross-check with METs. The Compendium lists stationary cycling at 200 to 229 W at 10.8 METs [2]. For a 75 kg rider: 10.8 x 75 x 2 = about 1,620 kcal, which falls inside the power-based range.
Use average power, not normalized power, for this calculation, because work equals average power multiplied by time.

Calories burned cycling by speed
Without a power meter, METs by speed are the next option. Speed is a weak proxy outdoors because wind, gradient, drafting and rolling resistance all change the power needed.
How many calories does running burn?
On flat ground, the energy cost of running per kilometer is roughly constant across speeds. A study of trained runners measured about 0.97 kcal per kg per km, independent of running speed [11], and an older comparison found the cost per mile of running did not change across 5 to 7 mph [12]. The same study noted wide variation in the oxygen cost of running between trained runners [11], so treat 1 kcal/kg/km as a starting estimate.
Worked example: 10 km run
Assumptions (estimate): 70 kg runner, 10 km on flat ground at 5:00 per km (12 km/h).
Energy cost: 70 kg x 10 km x 0.97 kcal/kg/km = about 680 kcal [11]
METs cross-check: running at 7.5 mph (12.1 km/h) is 11.8 METs [3]. 11.8 x 70 x (50 / 60) = about 690 kcal
Hills change the picture. The Compendium lists running at 6.0 mph up a 5% incline at 13.3 METs, compared with 9.3 METs at 6 to 6.3 mph on the flat [3].
How many calories does swimming burn?
Swimming has the widest range of the three. At any given speed, the energy cost of moving through water is higher than on land, because drag is far larger and propelling efficiency is lower [13]. Both drag and efficiency differ between strokes and between swimmers of different sex and technical level [13]. A wetsuit can lower the energy cost by reducing drag and increasing buoyancy [14].
Because the energy cost at a given speed depends on drag and efficiency [13], a pace-based MET value can misestimate the cost for a swimmer whose technique differs from the people who were measured. That is a limitation of any speed-based method.

Why do your watch and the formulas disagree?
METs are population averages. The standard MET assumes a fixed resting rate of 3.5 ml of oxygen per kg per minute. The Compendium’s own authors state that it was not developed to determine the precise energy cost of an activity for an individual, and that resting metabolic rate varies with age, body size, sex and lean mass [6].
Wrist devices estimate energy expenditure poorly. In a Stanford study of seven wrist-worn devices against indirect calorimetry, none achieved an energy expenditure error below 20%, even though most measured heart rate well [15]. Devices and algorithms have changed since 2017, so read this as a reason for caution, not a verdict on any current model. For more, see how accurate Garmin, WHOOP and Apple Watch calorie numbers are and why a power meter gives a better estimate than heart rate.
Gross vs net calories. MET values and gross efficiency both describe total energy expenditure, including the resting energy you would have used anyway [5, 7, 16]. By the MET definition, that resting share is about 1 kcal per kg per hour [5], although an individual’s true resting rate can differ [6]. For the 75 kg rider above, that is roughly 150 kcal of the 2-hour total that would have been burned sitting on the couch. This matters when deciding whether to eat back exercise calories.
How reload handles this
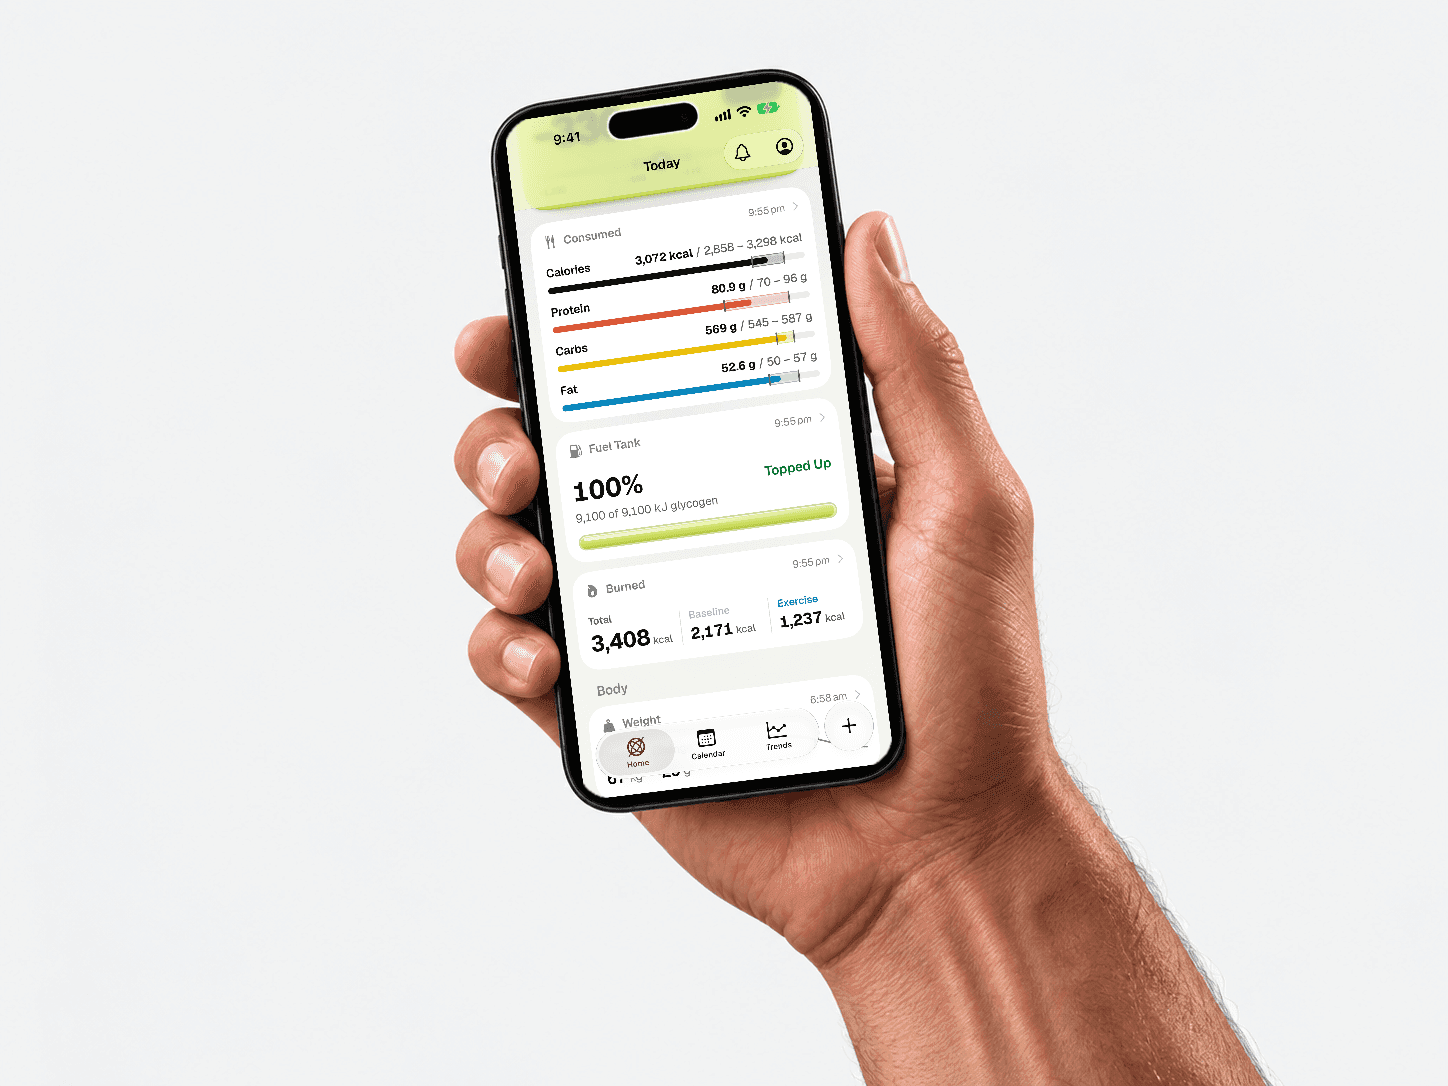
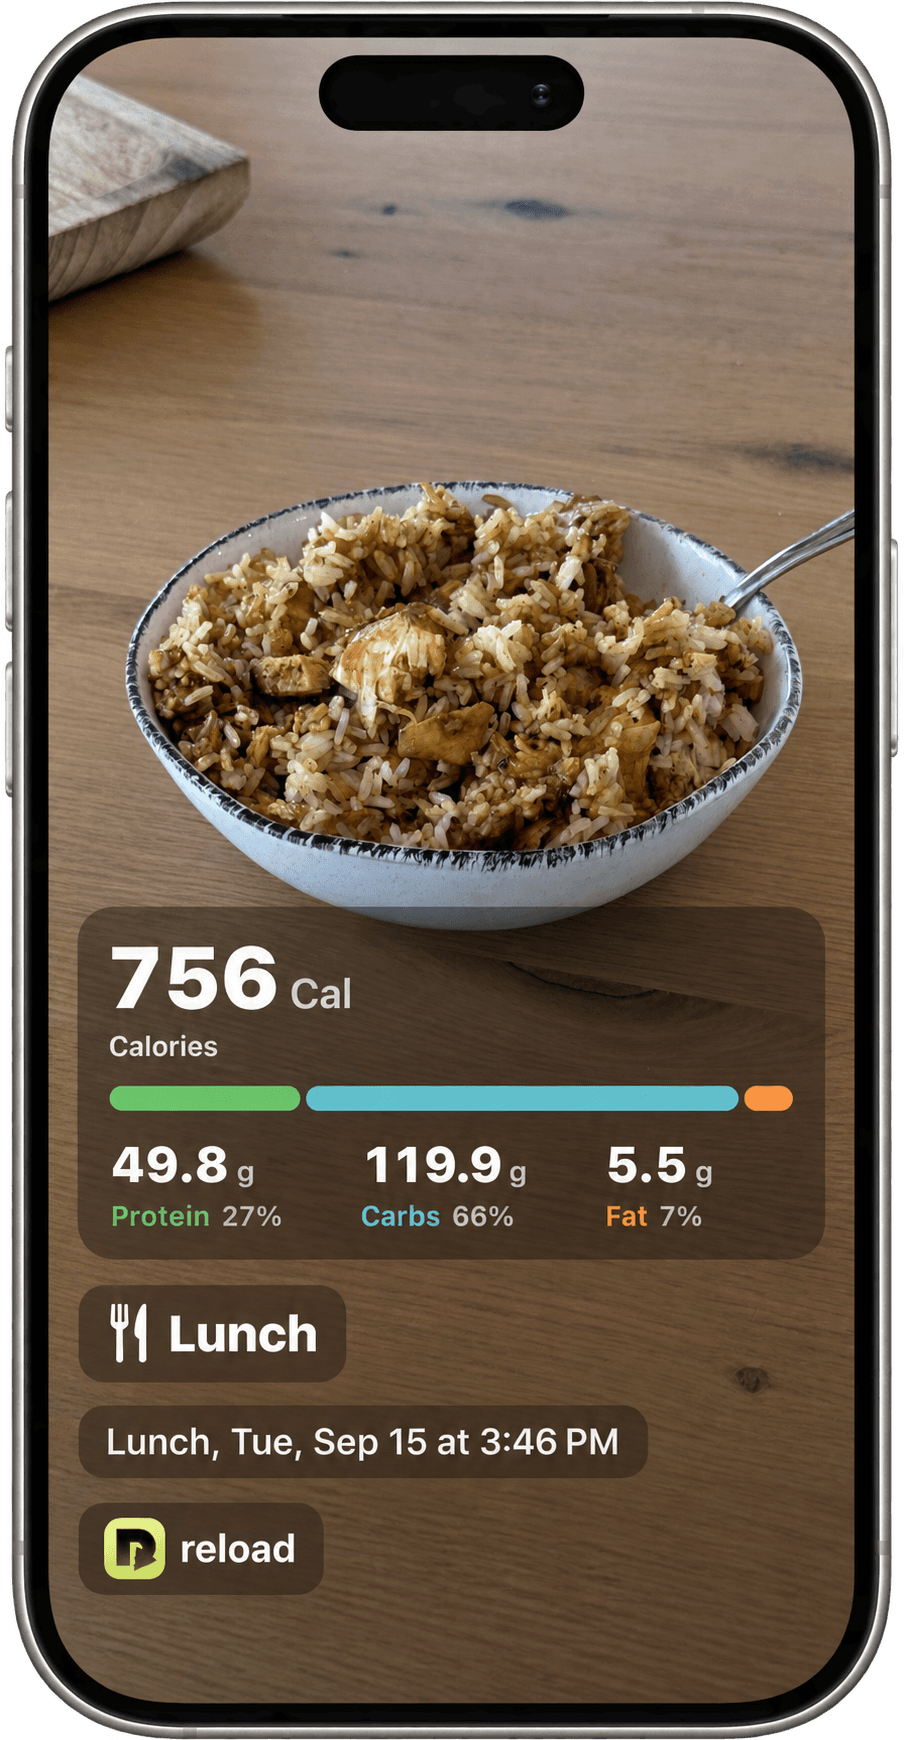
reload is a calorie and macro tracker built for endurance athletes. It reads the training you have done and the training you have planned, and sets daily calorie, protein, carbohydrate and fat targets, so a long ride day and a rest day get different targets. Energy burned is split into resting and active. Protein, carbs and fat each get a target range, and the app shows how the day’s targets were built. Like every calorie figure, these are estimates, not measurements. reload connects with Garmin, Wahoo, WHOOP and Apple Health and is available on iPhone. See plans and pricing.





FAQ
Is 1 kJ equal to 1 kcal in cycling?
Only approximately, and only if your gross efficiency is close to 24%. At 20% efficiency, each kJ of work costs about 1.2 kcal [8, 10].
Do you burn more calories running or cycling?
It depends on intensity and duration, not the sport itself. At the Compendium values, running at 7.5 mph (11.8 METs) and cycling at 16 to 19 mph (12.0 METs) are similar per hour [2, 3].
Does running faster burn more calories per km?
On flat ground, energy cost per km stays roughly constant across speeds, so faster running mainly burns more per hour, not per km [11].
Why does swimming vary so much?
Technique, drag and stroke change the energy cost of swimming substantially between individuals [13].
Scientific references16 sources, cited in the text as [1], [2] and so on
- 1Herrmann SD, Willis EA, Ainsworth BE, et al. 2024. 2024 Adult Compendium of Physical Activities: A third update of the energy costs of human activities. Journal of Sport and Health Science. doi.org/10.1016/j.jshs.2023.10.010
- 2Compendium of Physical Activities. 2024. Bicycling (Major Heading 01), 2024 Adult Compendium. pacompendium.com. pacompendium.com/bicycling (accessed October 29, 2026)
- 3Compendium of Physical Activities. 2024. Running (Major Heading 12), 2024 Adult Compendium. pacompendium.com. pacompendium.com/running (accessed October 29, 2026)
- 4Compendium of Physical Activities. 2024. Water Activities (Major Heading 18), 2024 Adult Compendium. pacompendium.com. pacompendium.com/water-activities (accessed October 29, 2026)
- 5Compendium of Physical Activities. 2024. Compendium of Physical Activities (home page, MET definition). pacompendium.com. pacompendium.com (accessed October 29, 2026)
- 6Compendium of Physical Activities. 2024. Corrected METs. pacompendium.com. pacompendium.com/corrected-mets/ (accessed October 29, 2026)
- 7Ettema G, Lorås HW. 2009. Efficiency in cycling: a review. European Journal of Applied Physiology. doi.org/10.1007/s00421-009-1008-7
- 8Moseley L, Jeukendrup AE. 2001. The reliability of cycling efficiency. Medicine and Science in Sports and Exercise. doi.org/10.1097/00005768-200104000-00017
- 9Lucía A, Hoyos J, Pérez M, Santalla A, Chicharro JL. 2002. Inverse relationship between VO2max and economy/efficiency in world-class cyclists. Medicine and Science in Sports and Exercise. doi.org/10.1249/01.MSS.0000039306.92778.DF
- 10National Institute of Standards and Technology. NIST Guide to the SI, Appendix B.8: Factors for Units Listed Alphabetically. NIST. nist.gov/node/777676
- 11Mayhew JL. 1977. Oxygen cost and energy expenditure of running in trained runners. British Journal of Sports Medicine. doi.org/10.1136/bjsm.11.3.116
- 12Miller JF, Stamford BA. 1987. Intensity and energy cost of weighted walking vs. running for men and women. Journal of Applied Physiology. doi.org/10.1152/jappl.1987.62.4.1497
- 13Zamparo P, Cortesi M, Gatta G. 2020. The energy cost of swimming and its determinants. European Journal of Applied Physiology. doi.org/10.1007/s00421-019-04270-y
- 14Quagliarotti C, Cortesi M, Gatta G, et al. 2021. Wetsuit Use During Open Water Swimming. Does It "Suit" Everybody? A Narrative Review. International Journal of Sports Physiology and Performance. doi.org/10.1123/ijspp.2020-0808
- 15Shcherbina A, Mattsson CM, Waggott D, et al. 2017. Accuracy in Wrist-Worn, Sensor-Based Measurements of Heart Rate and Energy Expenditure in a Diverse Cohort. Journal of Personalized Medicine. doi.org/10.3390/jpm7020003
- 16Coyle EF, Sidossis LS, Horowitz JF, Beltz JD. 1992. Cycling efficiency is related to the percentage of type I muscle fibers. Medicine and Science in Sports and Exercise. pubmed.ncbi.nlm.nih.gov/1501563/

Live now on iPhone.
Choose your plan, check out on the web and get reload on your iPhone today. Android is coming to Google Play next, so join the Android list and you’ll be the first to know when it lands.

