Data and tech
Power meter vs heart rate calories: which is better?
Why a power meter gives a better cycling calorie estimate than heart rate: kJ of work, gross efficiency, why kJ is near kcal, and what skews heart rate.

On the bike, a calibrated power meter gives a better calorie estimate than heart rate because it measures the mechanical work you did, in kilojoules (kJ). The only big assumption left is your gross efficiency, which in the studies cited here falls in a range of roughly 19 to 25 percent [1][2][4][8]. Heart rate estimates energy indirectly and can rise with heat and duration while your energy cost barely changes [5][11].
What does a power meter actually measure?
A power meter measures power in watts, and one watt is one joule per second [6]. Multiply average power by ride time and you get the mechanical work done on the pedals:
work (kJ) = average power (W) x time (s) / 1,000
A 3-hour ride at an average of 200 W is 200 x 10,800 / 1,000 = 2,160 kJ of work. That figure is what your head unit or training software shows as “kJ” or “work”.
This is external work delivered to the bike. Your body spends more energy than that, because most of the chemical energy you release becomes heat rather than work, as the efficiency values below show [1][4].

How do you convert kJ of work to calories burned?
Gross efficiency (GE) is the ratio of work done to energy expended [3][7]. To estimate energy expended:
energy expended (kJ) = work (kJ) / GE
Then convert to kilocalories. One kilocalorie (thermochemical) is exactly 4.184 kJ [6]:
energy expended (kcal) = work (kJ) / (GE x 4.184)
What gross efficiency should you assume?
Laboratory studies in trained cyclists report gross efficiency values across a fairly narrow band:
Two patterns matter for estimating calories:
GE depends on work rate. It rises with power output, mainly because baseline energy use makes up a smaller share of the total at higher power [7]. In the Moseley study, GE was significantly lower at 95 W and 130 W than at 165 W and above [1].
GE varies between riders. Training may raise it [9], and in a group of highly trained cyclists, efficiency was positively correlated with the percentage of type I muscle fibers [3].
Why are kJ roughly equal to kcal on a bike?
Put a GE of about 24 percent into the formula and the conversion factor is 1 / (0.24 x 4.184), which is about 1.0. Work in kJ and energy burned in kcal come out at nearly the same number. That is the arithmetic behind the common “kJ equals kcal” rule.
Most riders are not at 24 percent GE on most rides, so treat the rule as a rounded estimate. The chart shows the effect of GE on our 2,160 kJ example. These are our calculations from the formula above, not measured values.
At the 19 to 20 percent GE reported in two of the studies above [1][2], energy burned would be about 20 to 26 percent higher than the “kJ equals kcal” rule suggests. It also covers only pedaling. Coasting and stops add resting energy use that the power file does not record. For a broader view of how much you burn by sport, see how many calories you burn cycling, running and swimming.
Why is heart rate a weaker input for calories?
Heart rate is an indirect signal. To turn it into calories, a model has to predict how much oxygen you use at a given heart rate. In one study of 115 regularly exercising adults, a heart rate model that included age, sex, body mass and VO2max explained 83.3 percent of the variance in energy expenditure (r = 0.913). Without VO2max, it explained 73.4 percent (r = 0.857) [10]. That is useful at the group level, but it leaves real error for an individual, and it assumes your heart rate response stays stable. Several things break that assumption.
Cardiovascular drift
During prolonged exercise at a constant workload, heart rate rises progressively while stroke volume falls [5]. In nine cyclists riding at 60 percent of VO2max in 35 °C heat, heart rate rose 12 percent between minute 15 and minute 45 (from 151 to 169 bpm). Submaximal oxygen uptake, the actual driver of energy expenditure, increased only slightly [11]. A heart rate model reads that drift as a higher calorie burn.
Heat
Heat stress is a common setting for this drift, and the study above was run at 35 °C [11]. On hot days, treat heart-rate-based calorie numbers with extra caution, because the work done at a given power does not change.
Fatigue and accumulated training
A meta-analysis of overload training in competitive athletes found that longer overload periods produced a small decrease in heart rate during submaximal and maximal exercise [12]. Heart rate at a given power can therefore read low when you are fatigued, which would push a heart rate model to underestimate.
Caffeine
Caffeine is often listed as a heart rate confounder, but the evidence does not support that for steady exercise. A meta-analysis of 26 double-blind crossover studies using 3 to 6 mg/kg found no effect of caffeine on heart rate during submaximal exercise. Caffeine did raise ventilation, blood lactate and blood glucose, and it lowered perceived exertion [13]. Do not expect caffeine at 3 to 6 mg/kg to explain a shift in your heart rate at a given power.
How accurate are power meters themselves?
Power meters are not perfect either. In a test of 54 power meters from 9 manufacturers against a first-principles treadmill model, mean deviation was -0.9 ± 3.2 percent, and 6 units deviated by more than 5 percent. Precision was high, with a coefficient of variation of 1.2 ± 0.9 percent [14]. Calibrate or zero offset your power meter as the manufacturer recommends. A few percent of measurement error is still small next to the uncertainty in gross efficiency and the error ranges reported for wrist-based calorie estimates. See how accurate Garmin, WHOOP and Apple Watch calorie numbers are.
When is heart rate still the right tool?
Heart rate remains valuable for pacing, for tracking how your body is coping with the work, and for sports where you have no power data. The point is narrower than “heart rate is bad”. For estimating calories on the bike, measured work divided by a sensible efficiency is a more direct method than a heart rate model.
A practical method
Read the ride’s kJ from your head unit or training software.
Decide on an efficiency assumption. Riders at moderate endurance power are probably closer to the lower GE values above, and very strong riders at high power closer to the upper ones [1][4][7].
Convert with kcal = kJ / (GE x 4.184), or use kJ x 0.96 to 1.26 as a rounded range (19 to 25 percent GE).
Check the estimate against your body mass trend and training quality over several weeks. Use that to decide whether to eat back the calories you burn and how many carbs per hour to plan.
How reload handles this
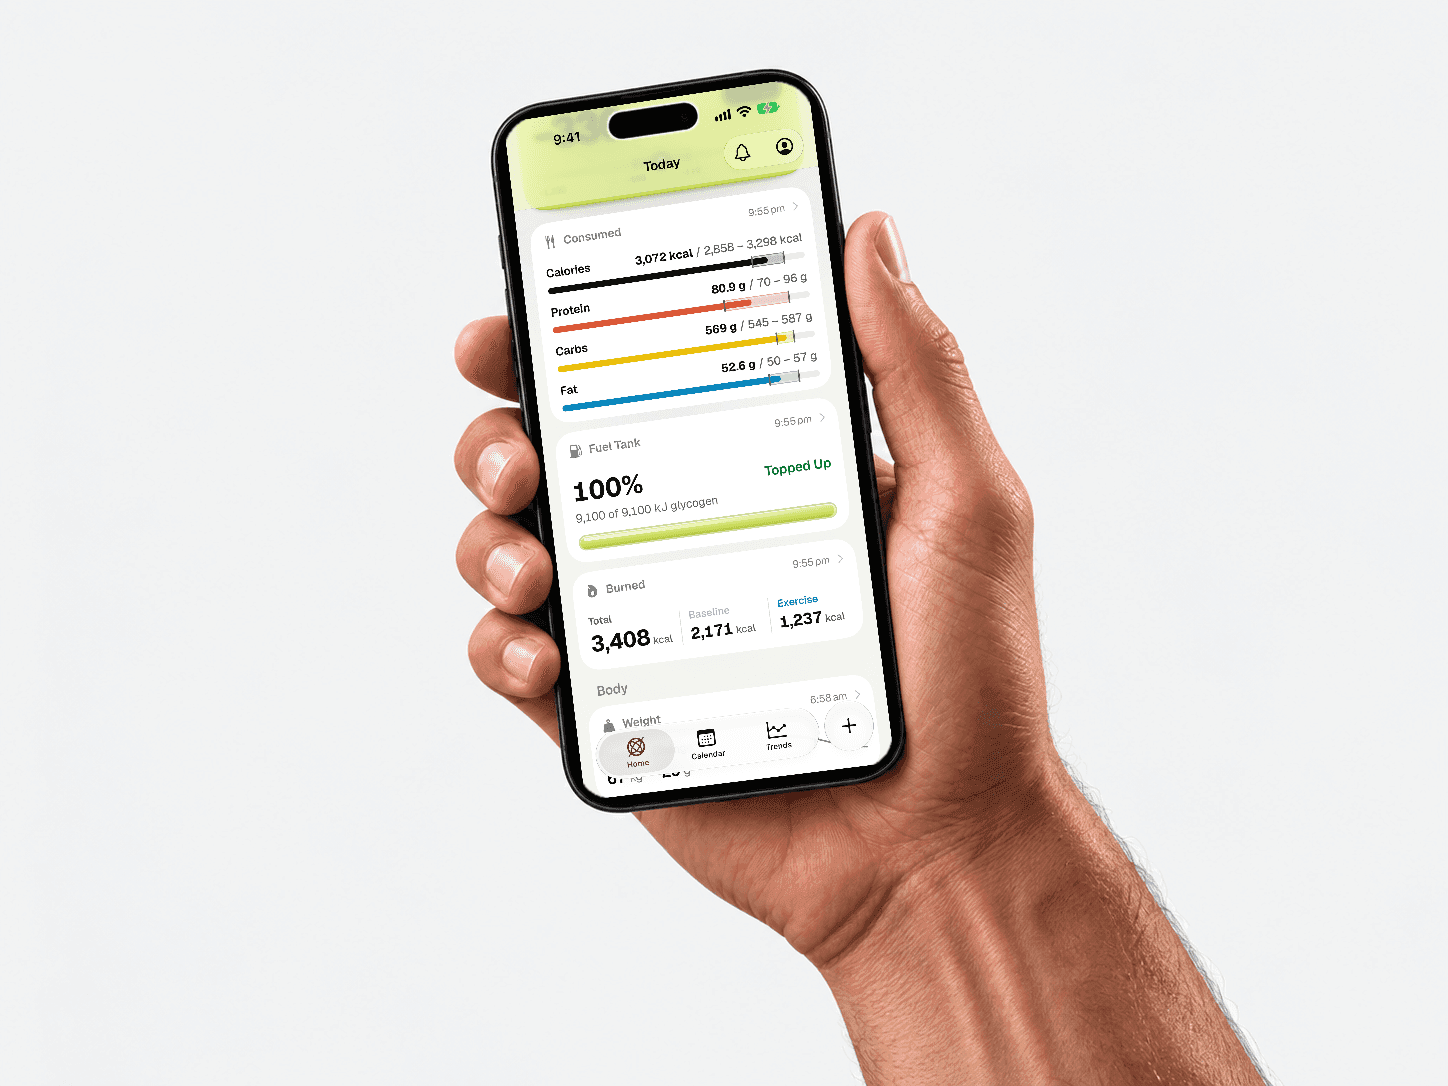
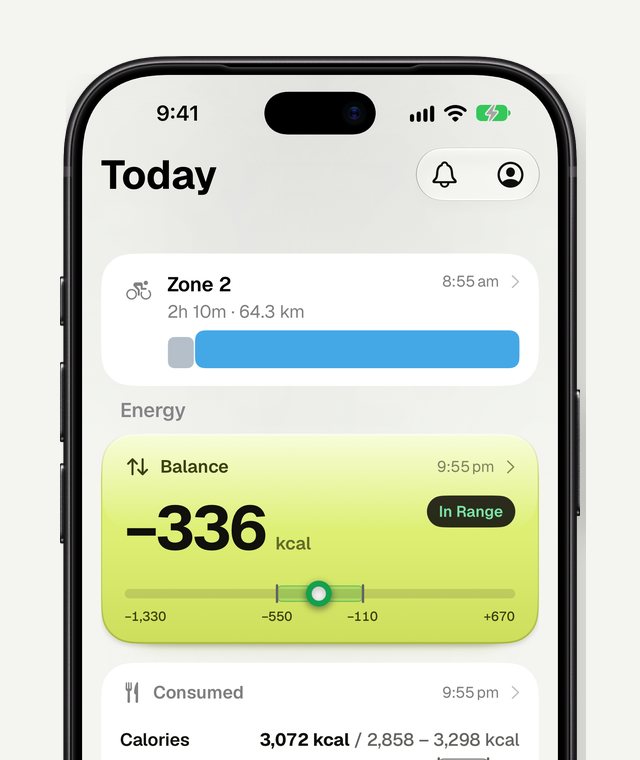
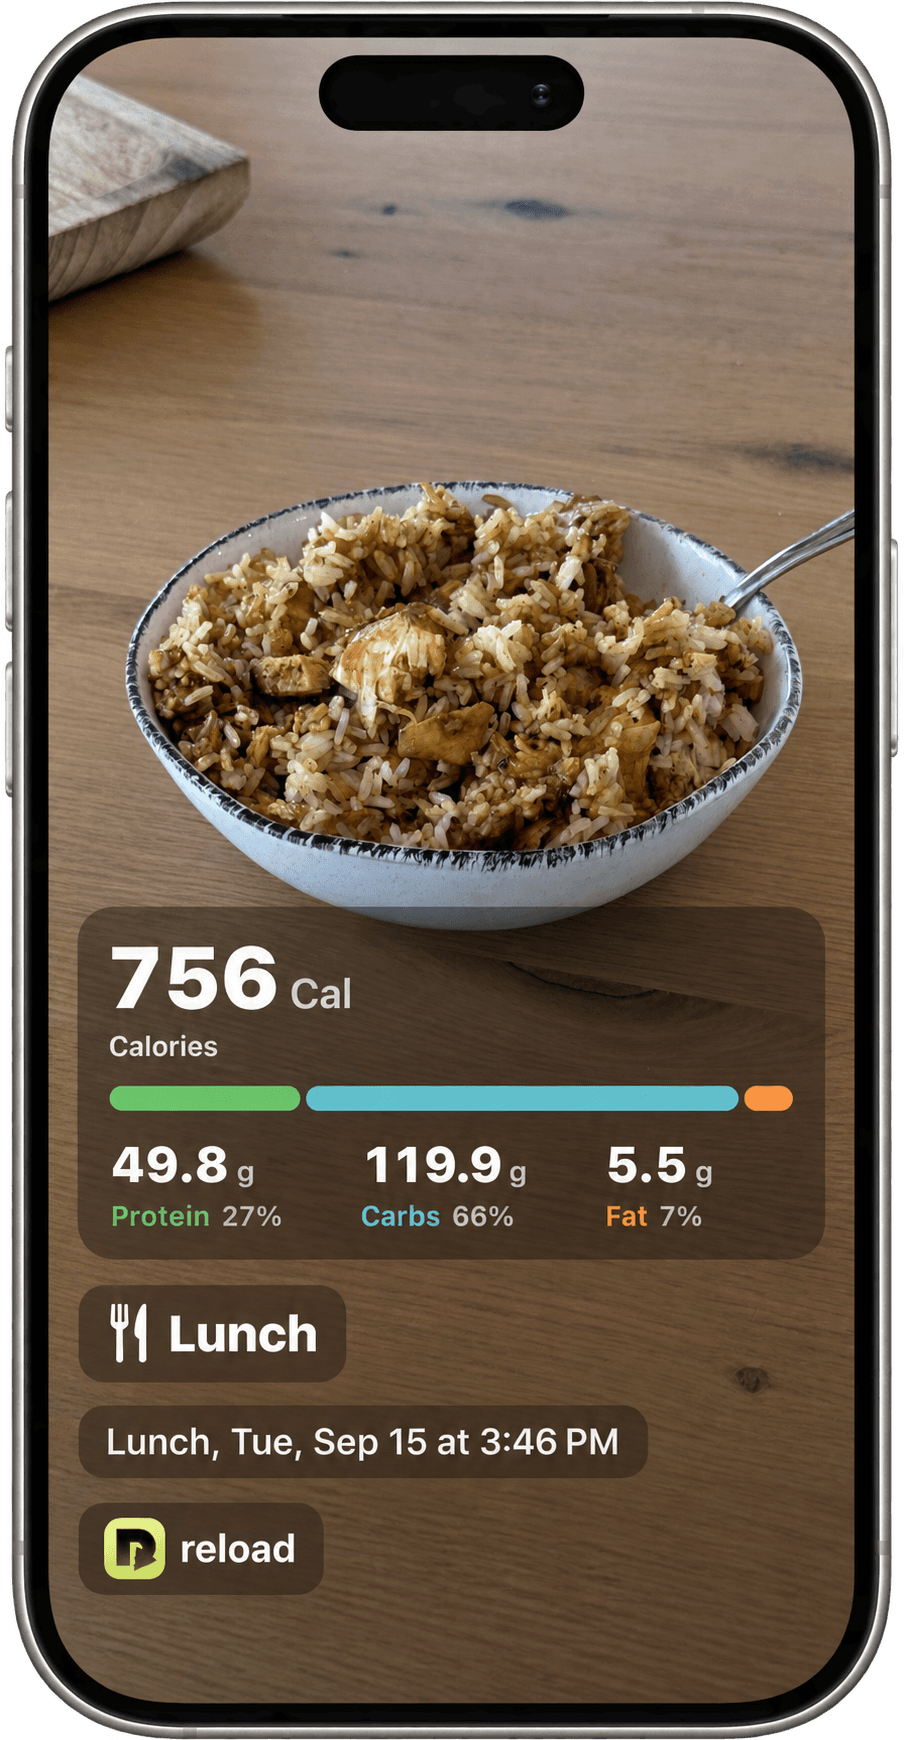
reload is a calorie and macro tracker built for endurance athletes. It connects to Garmin, Wahoo, WHOOP and Apple Health, reads the training you have done and the training you have planned, and sets daily calorie, protein, carbohydrate and fat targets, so a long ride day and a rest day get different targets. Energy burned is split into resting and active, and the app shows how each day’s targets were built. For cycling analysis, reload shows your power curve against your 90-day best with threshold marked, plus time in zone per session. Protein, carbs and fat each get a target range rather than a single number. See plans and pricing.




FAQ
Is 1 kJ of cycling work equal to 1 kcal burned?
Only at a gross efficiency of about 24 percent. At the 19 to 20 percent efficiency reported in two studies of trained cyclists, energy burned is about 1.2 to 1.26 kcal per kJ of work [1][2][6].
Does a power meter measure calories directly?
No. It measures mechanical work. Calories burned are estimated from that work using an assumed efficiency.
Why does my heart rate climb on long rides at the same power?
That is cardiovascular drift. Heart rate rises over time at a constant workload, including in the heat, while oxygen uptake changes only slightly [5][11].
Can I use the kJ rule for running?
No. The kJ figure comes from a cycling power meter. The relationship between running power estimates and energy cost is a separate question.
Scientific references14 sources, cited in the text as [1], [2] and so on
- 1Moseley L, Jeukendrup AE, 2001, The reliability of cycling efficiency, Medicine and Science in Sports and Exercise, doi.org/10.1097/00005768-200104000-00017
- 2Artetxe-Gezuraga X, Maldonado-Martín S, Freemye BG, Cámara J, 2019, Gross Efficiency and The Relationship with Maximum Oxygen Uptake in Young Elite Cyclists During the Competitive Season, Journal of Human Kinetics, doi.org/10.2478/hukin-2018-0089
- 3Coyle EF, Sidossis LS, Horowitz JF, Beltz JD, 1992, Cycling efficiency is related to the percentage of type I muscle fibers, Medicine and Science in Sports and Exercise, pubmed.ncbi.nlm.nih.gov/1501563/
- 4Lucía A, Hoyos J, Pérez M, Santalla A, Chicharro JL, 2002, Inverse relationship between VO2max and economy/efficiency in world-class cyclists, Medicine and Science in Sports and Exercise, doi.org/10.1249/01.MSS.0000039306.92778.DF
- 5Coyle EF, González-Alonso J, 2001, Cardiovascular drift during prolonged exercise: new perspectives, Exercise and Sport Sciences Reviews, doi.org/10.1097/00003677-200104000-00009
- 6National Institute of Standards and Technology, NIST Guide to the SI, Appendix B.8: Factors for Units Listed Alphabetically (checked October 29, 2026), nist.gov/pml/special-publication-811/nist-guide-si-appendix-b-conversion-factors/nist-guide-si-appendix-b8
- 7Ettema G, Lorås HW, 2009, Efficiency in cycling: a review, European Journal of Applied Physiology, doi.org/10.1007/s00421-009-1008-7
- 8Andersson EP, Bachl P, Schmuttermair A, et al., 2022, Anaerobic work capacity in cycling: the effect of computational method, European Journal of Applied Physiology, doi.org/10.1007/s00421-022-05038-7
- 9Hopker J, Passfield L, Coleman D, et al., 2009, The effects of training on gross efficiency in cycling: a review, International Journal of Sports Medicine, doi.org/10.1055/s-0029-1237712
- 10Keytel LR, Goedecke JH, Noakes TD, et al., 2005, Prediction of energy expenditure from heart rate monitoring during submaximal exercise, Journal of Sports Sciences, doi.org/10.1080/02640410470001730089
- 11Wingo JE, Lafrenz AJ, Ganio MS, Edwards GL, Cureton KJ, 2005, Cardiovascular drift is related to reduced maximal oxygen uptake during heat stress, Medicine and Science in Sports and Exercise, doi.org/10.1249/01.mss.0000152731.33450.95
- 12Bosquet L, Merkari S, Arvisais D, Aubert AE, 2008, Is heart rate a convenient tool to monitor over-reaching? A systematic review of the literature, British Journal of Sports Medicine, doi.org/10.1136/bjsm.2007.042200
- 13Glaister M, Gissane C, 2018, Caffeine and Physiological Responses to Submaximal Exercise: A Meta-Analysis, International Journal of Sports Physiology and Performance, doi.org/10.1123/ijspp.2017-0312
- 14Maier T, Schmid L, Müller B, Steiner T, Wehrlin JP, 2017, Accuracy of Cycling Power Meters against a Mathematical Model of Treadmill Cycling, International Journal of Sports Medicine, doi.org/10.1055/s-0043-102945

Live now on iPhone.
Choose your plan, check out on the web and get reload on your iPhone today. Android is coming to Google Play next, so join the Android list and you’ll be the first to know when it lands.

